In [88]:
%matplotlib inline
import numpy as np
import matplotlib.pyplot as plt
import matplotlib.animation as ani
import IPython.display as disp
import time
Def: Mandelbrot Set
Let $z_n \in \mathbb{C}$ be the series recursively defined by: $$z_{n+1} = z_n^2 + c$$ with $z_0 = 0$.
The Mandelbrot Set $M$ is defined by: $$M := \big\{ c \in \mathbb{C} \big| \; \; z_n \text{convergent} \big\}$$
Lemma: Mandelbrot convergence Test
(Proof omitted) $$\exists n \in \mathbb{N}: \big| z_n \big| > 2 \Rightarrow z_n \text{divergent}$$
In [2]:
X = np.linspace(-2, 1, 842)
Y = np.linspace(-1.3, 1.3, 624)

x, y = np.meshgrid(X, Y)
c = x + 1j*y

z = np.zeros_like(c)

for n in range(50):
    z = z**2 + c

M = np.abs(z) <= 2
M = M.astype(np.float32)
In [3]:
plt.figure(figsize=(15, 7))
plt.imshow(M)
plt.colorbar()
Out[3]:
Improving visual appeal
Idea: Encode info about speed of convergence in color
Def: Convergence Number $N$ $$ N = \Big\{ n \in \mathbb{N} \; \Big| \; \big| z_n \big| > 2 \wedge \big| z_{n-1} \big| \le 2 \Big\}$$
In [5]:
max_iterations = 50

extent = [-2, 0.8, -1.3, 1.3]

X = np.linspace(*extent[:2], 842)
Y = np.linspace(*extent[2:], 624)

x, y = np.meshgrid(X, Y)
c = x + 1j*y

z = np.zeros_like(c)
z_next = np.zeros_like(c)

N = max_iterations*np.ones_like(c).astype(np.int32)

abs2 = lambda z: np.real(z)**2 + np.imag(z)**2

for n in range(max_iterations):
    z_next = z**2 + c
    N[np.logical_and(abs2(z_next)>4, abs2(z)<=4)] = n
    z = z_next
In [6]:
plt.figure(figsize=(15, 7))
plt.imshow(N, cmap=plt.cm.brg, extent=extent)
plt.colorbar()
Out[6]:
Putting it all together
In [114]:
def mandelbrot_img(iterations=50, extent=[-2, 0.8, -1.3, 1.3], res=(480, 320)):
    with np.warnings.catch_warnings():
        np.warnings.filterwarnings('ignore')
        X = np.linspace(*extent[:2], res[0])
        Y = np.linspace(*extent[2:], res[1])

        x, y = np.meshgrid(X, Y)
        c = x + 1j*y

        z = np.zeros_like(c)
        z_next = np.zeros_like(c)

        N = iterations*np.ones_like(c).astype(np.int32)

        abs2 = lambda z: np.real(z)**2 + np.imag(z)**2

        abs_old = np.zeros_like(c)
        abs_next = np.zeros_like(c)

        for n in range(iterations):
            z_next = z**2 + c
            abs_next = abs2(z_next)
            N[np.logical_and(abs_next>4, abs_old<=4)] = n
            z = z_next
            abs_old = abs_next

        return np.log(N)/np.log(2)

def mandelbrot(ax=None, iterations=50, extent=[-2, 0.8, -1.3, 1.3], img=None, res=(480, 320)):
        data = mandelbrot_img(iterations, extent, res)

        if ax is not None:
            img = ax.imshow(data, cmap=plt.cm.hot, extent=extent)
        else:
            img.set_data(data)
            img.set_extent(extent)
        return img
In [87]:
t_start = time.time()
a, b = 3, 3
I = a*b
fig, axs = plt.subplots(a, b, figsize=(15, 15))
c0 = -0.7499-0.0303j
s = 1.5
t_img = time.time()
for l in range(a):
    for m in range(b):
        mandelbrot(axs[l][m], 1000, [c0.real-s, c0.real+s, c0.imag-s, c0.imag+s])
        axs[l][m].set_title("scale = %3.3e" % s)
        axs[l][m].ticklabel_format(style='sci', axis='x', scilimits=(0,0))
        axs[l][m].ticklabel_format(style='sci', axis='y', scilimits=(0,0))
        t = time.time()
        print("plotet img s = %3.3e, total itime: %3.3fs" % (s, t - t_img))
        t_img = t
        s *= 0.3
print("Done ploting toatal time: %3.3fs" % (time.time() - t_start))
In [141]:
t_start = time.time()
fig, ax = plt.subplots(1, 1, figsize=(10, 10))
c0 = -0.7499-0.0303j
s = 1.5
img = mandelbrot(ax, 3000, [c0.real-s, c0.real+s, c0.imag-s, c0.imag+s], None)
ax.set_title("scale = %3.3e" % s)
ax.ticklabel_format(style='sci', axis='x', scilimits=(0,0))
ax.ticklabel_format(style='sci', axis='y', scilimits=(0,0))

def animate(i):
    global s, c0, img, ax
    img = mandelbrot(None, 9000, [c0.real-s, c0.real+s, c0.imag-s, c0.imag+s], img, res=(320, 320))
    ax.set_title("scale = %3.3e" % s)
    s *= 0.84
    print("rendered frame number = %s" % i)
    return img, ax

animation = ani.FuncAnimation(fig, animate, np.linspace(0, 240, 240), interval=1, blit=False)

animation.save('m-ani.mp4', fps=30, extra_args=['-vcodec', 'libx264'])

print("Done ploting toatal time: %3.3fs" % (time.time() - t_start))

plt.close()
In [143]:
%%html
<h3>9000 iterations, -0.7499-0.0303j, s*=0.84</h3>
<video width="640" height="480" controls>
  <source src="m-ani.mp4" type="video/mp4">
</video>
<h3>Older verison 3866.420s, 3000 iterations, -0.7499-0.0303j, s*=0.86</h3>
<video width="640" height="480" controls>
  <source src="m-ani-3000.mp4" type="video/mp4">
</video>
In [135]:
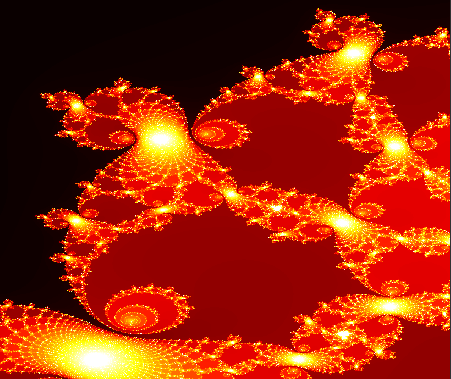
# Render Nice title Img
fig, ax = plt.subplots(1, 1, figsize=(18, 7))
mandelbrot(ax, 3000, [-0.74995, -0.74985, -0.030225, -0.030375], res=(820, 640))
ax.set_aspect(9/16)
fig.savefig("mandel.png")
In [ ]:
